matplotlib基本用法

matplotlib用法

下载本次实验

准备

1
2
3
import matplotlib.pyplot as plt
import numpy as np
%matplotlib inline

基本图像绘制

折线图(Line Plot):

  • 适用特征:用于显示数据随时间或有序类别变化的趋势,例如时间序列数据、股票价格等。
1
2
3
4
5
6
7
8
x = [1, 2, 3, 4, 5]
y = [2, 4, 6, 8, 10]

plt.plot(x, y)
plt.xlabel('x')
plt.ylabel('y')
plt.title('Line Plot')
plt.show()
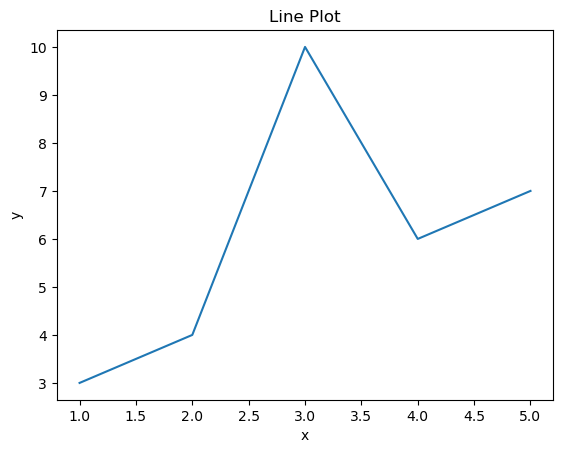
line_plot_1

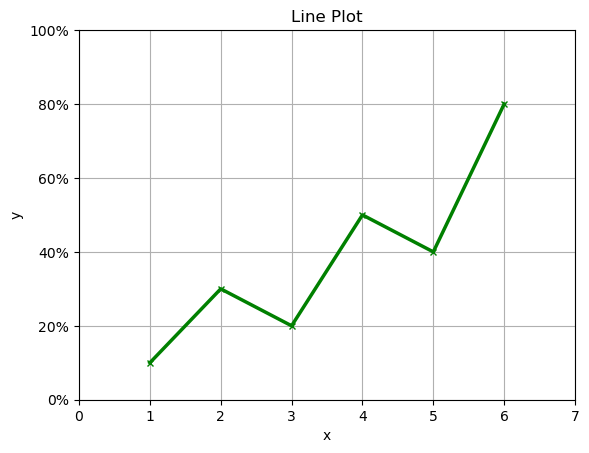
当然可以传入一些自定义的参数,看一组示例:

1
2
3
4
5
6
7
8
x = np.array([1,2,3,4,5,6])
y = np.array([1,3,2,5,4,8])
plt.plot(x,y,linestyle='-',color='green',linewidth=2.5,marker='x',markerfacecolor='black',markersize=5)
plt.xlabel('x')
plt.ylabel('y')
plt.xlim(np.min(x)-1,np.max(x)+1)
plt.yticks([0, 2, 4, 6, 8, 10], ['0%', '20%', '40%', '60%', '80%', '100%'])
plt.grid(True) #网格线
line_plot_2

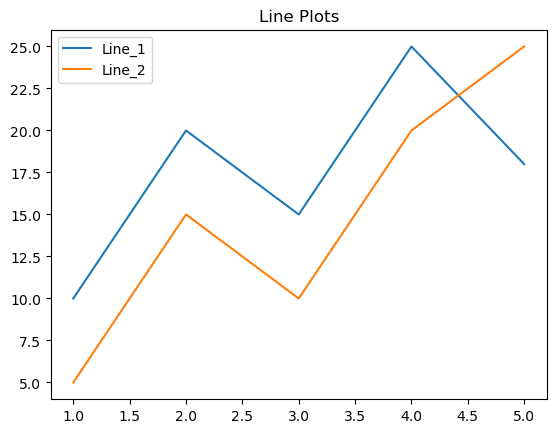
也可以包含多组折线

1
2
3
4
5
6
7
8
9
x = np.array([1, 2, 3, 4, 5])
y1 = np.array([10, 20, 15, 25, 18])
y2 = np.array([5, 15, 10, 20, 25])

plt.plot(x, y1, label='Line_1')
plt.plot(x, y2, label='Line_2')
plt.title('Line Plots')

plt.legend()
line_plot_3

散点图(Scatter Plot):

  • 适用特征:用于显示两个变量之间的关系,例如相关性、聚类等。
1
2
3
4
5
6
7
x = np.linspace(-2*np.pi,2*np.pi,100)
y = np.array(np.sin(x))

plt.scatter(x,y,marker='s',color='red')
plt.xlabel('x')
plt.ylabel('y')
plt.title('Scatter Plot')
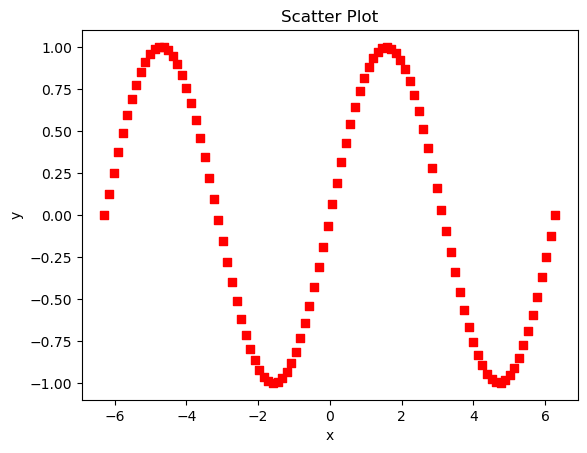
image-20231229164950540

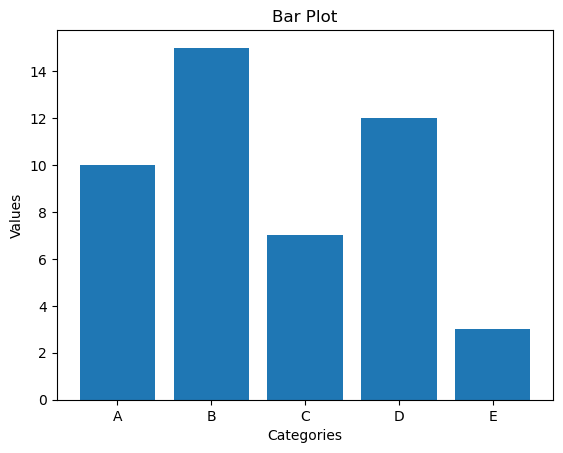
柱状图(Bar Plot):

  • 适用特征:用于比较不同类别之间的数据,例如不同产品的销售额、不同地区的人口数量等。
1
2
3
4
5
6
7
8
categories = ['A', 'B', 'C', 'D']
values = [10, 15, 7, 12]

plt.bar(categories, values)
plt.xlabel('Categories')
plt.ylabel('Values')
plt.title('Bar Plot')
plt.show()
bar_plot_1

当块数较多时,可以通过不同颜色来区分,提供两种方案

  1. 自定义有限数目的颜色,通过颜色循环填充较多的块

    1
    2
    3
    4
    5
    6
    7
    8
    9
    10
    categories = np.array(['A', 'B', 'C', 'D', 'E', 'F', 'G', 'H', 'I', 'J', 'K', 'L', 'M', 'N', 'O', 'P', 'Q', 'R', 'S', 'T'])
    values = np.array([10, 20, 15, 25, 8, 12, 18, 6, 9, 22, 16, 14, 11, 7, 13, 19, 17, 23, 21, 24])

    colors = ['red', 'blue', 'green']
    bar_colors = [colors[i % len(colors)] for i in range(len(categories))]

    plt.bar(categories, values, color=bar_colors,alpha=0.3)
    plt.xlabel('Categories')
    plt.ylabel('Values')
    plt.title('Bar Plot')
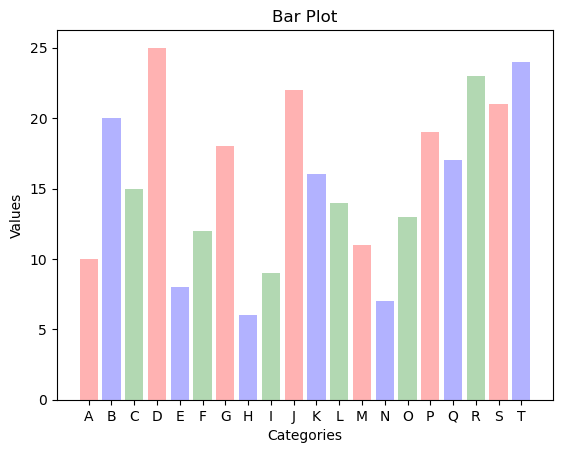
    bar_plot_2
  2. 使用一种颜色,通过matplotlib的内置颜色映射,根据y_values的数值大小划分颜色深浅(推荐)

    1
    2
    3
    4
    5
    6
    7
    8
    categories = np.array(['A', 'B', 'C', 'D', 'E', 'F', 'G', 'H', 'I', 'J', 'K', 'L', 'M', 'N', 'O', 'P', 'Q', 'R', 'S', 'T'])
    values = np.array([10, 20, 15, 25, 8, 12, 18, 6, 9, 22, 16, 14, 11, 7, 13, 19, 17, 23, 21, 24])

    normalized_values = (values - np.min(values)) / (np.max(values) - np.min(values)) #归一化
    plt.bar(categories, values, color=plt.cm.Greens(normalized_values))
    plt.xlabel('Categories')
    plt.ylabel('Values')
    plt.title('Bar Plot')
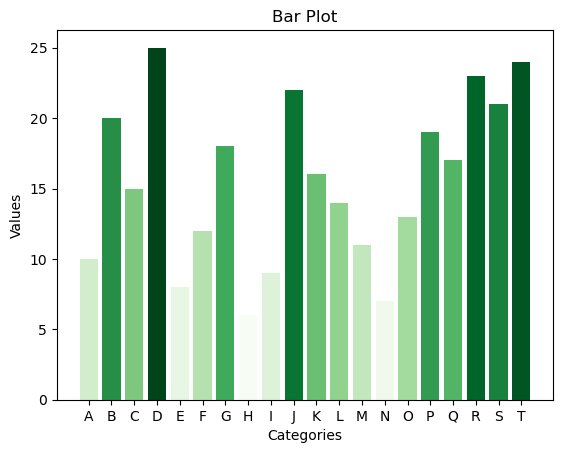
    bar_plot_3

    在此基础上,可以给每个bar添加数值标签

    1
    2
    3
    4
    5
    6
    7
    8
    9
    10
    11
    12
    13
    14
    15
    16
    17
    18
    19
    20
    21
    categories = np.array(['A', 'B', 'C', 'D', 'E', 'F', 'G', 'H', 'I', 'J', 'K', 'L', 'M', 'N', 'O', 'P', 'Q', 'R', 'S', 'T'])
    values = np.array([10, 20, 15, 25, 8, 12, 18, 6, 9, 22, 16, 14, 11, 7, 13, 19, 17, 23, 21, 24])

    normalized_values = (values - np.min(values)) / (np.max(values) - np.min(values)) #归一化
    plt.bar(categories, values, color=plt.cm.Greens(normalized_values))
    plt.xlabel('Categories')
    plt.ylabel('Values')
    plt.title('Bar Plot')
    for i, v in enumerate(values):
    plt.text(categories[i], v, str(v), ha='center', va='bottom')
    '''
    plt.text用于打印文本,依次包含坐标参数,文本内容,水平对齐方式(ha),垂直对齐方式(va)
    水平对齐方式:
    `left`:将文本标签的左侧与给定坐标对齐。
    `center`:将文本标签的中心与给定坐标对齐。
    `right`:将文本标签的右侧与给定坐标对齐。

    垂直对齐方式:
    `top`:将文本标签的顶部与给定坐标对齐。
    `center`:将文本标签的中心与给定坐标对齐。
    `bottom`:将文本标签的底部与给定坐标对齐。
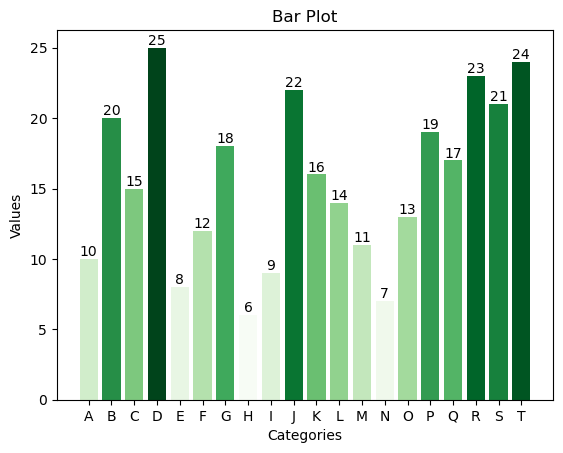
    bar_plot_4

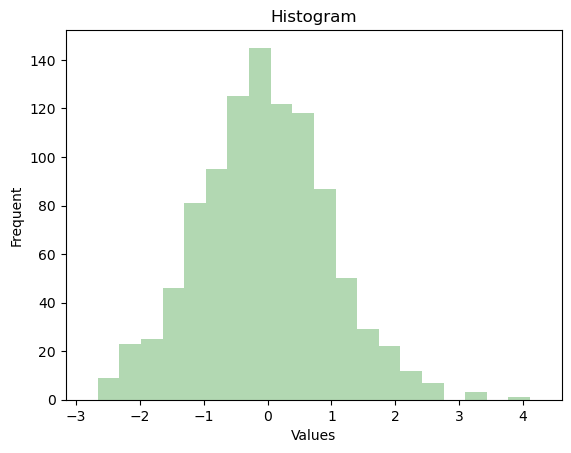
直方图(Histogram):

  • 适用特征:用于显示数据的分布情况,例如连续变量的频率分布。
1
2
3
4
5
6
7
8
np.random.seed(2)
data = np.random.randn(1000)

plt.hist(data,bins=20,color='green',alpha=0.3)
plt.xlabel('Values')
plt.ylabel('Frequent')
plt.title('Histogram')
plt.xlim(np.min(data)-0.5,np.max(data)+0.5)
histogram_1

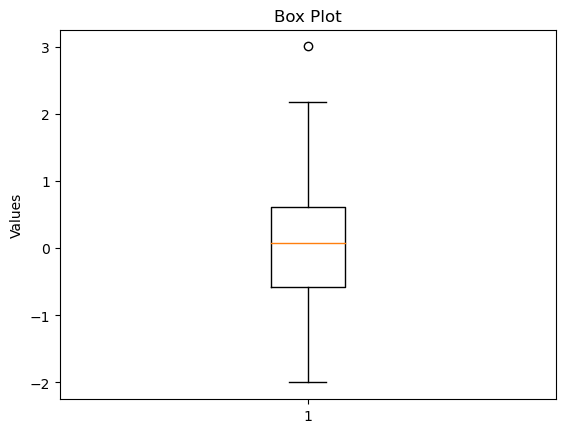
箱线图(Box Plot):

  • 适用特征:用于显示数据的分布和异常值情况,例如数据的中位数、上下四分位数、离群值等。
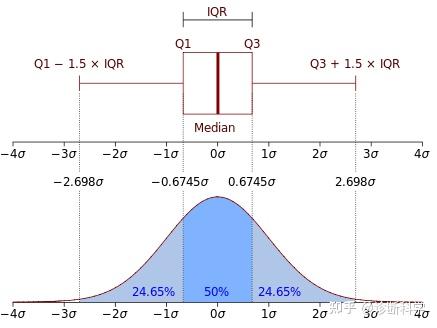
    box_plot_1
1
2
3
4
5
data = np.random.randn(100)

plt.boxplot(data)
plt.ylabel('Values')
plt.title('Box Plot')
box_plot_2

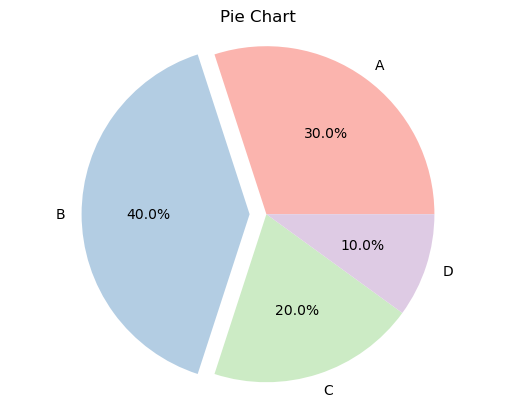
饼图(Pie Chart):

  • 适用特征:用于显示不同类别在整体中的占比情况,例如不同产品的市场份额。
1
2
3
4
5
6
7
8
sizes = [30, 40, 20, 10]
labels = ['A', 'B', 'C', 'D']
colors = plt.cm.Pastel1(range(len(labels))) #Pastel1——内置颜色映射方案(Pastel1,Pastel2,Set1)
explode = [0, 0.1, 0, 0]

plt.pie(sizes, labels=labels, explode=explode, colors=colors, autopct='%1.1f%%') #explode——离散度,autopct='%1.1f%%'——百分比显示一位小数
plt.title('Pie Chart')
plt.axis('equal')
pie_chart_1

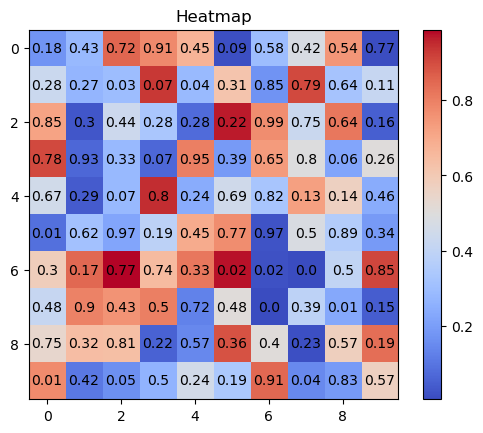
热力图(Heatmap):

  • 适用特征:用于显示两个变量之间的关系,并通过颜色编码显示数值大小,例如相关矩阵、特征相关性等
1
2
3
4
5
6
7
8
9
10
11
data = np.random.rand(10,10)

plt.imshow(data, cmap='coolwarm')
plt.colorbar()
plt.title('Heatmap')

x, y = np.indices(data.shape)
labels = data.flatten().round(2)
x,y = x.flatten(), y.flatten()
for i in range(len(labels)):
plt.text(x[i], y[i], str(labels[i]), ha='center', va='center', color='black')
heatmap_1

此种方法性能低下,理论上可以使用矩阵运算提高性能,未完待续……


matplotlib基本用法
https://blog.potential.icu/2023/12/29/matplotlib基本用法/
Author
Xt-Zhu
Posted on
December 29, 2023
Licensed under